We are Officially Certified Salesforce Partners!
VDOIT Technologies is now a certified Salesforce partner. This new certification enables us to offer our clients an even wider suite of services, seamlessly integrating Tableau with Salesforce to deliver unparalleled insights and drive business growth.
Let our expertise in both take your data representation to the next level!
Get In Touch
Visualize Value With Tableau
Empower your organization with Tableau, the industry-leading data visualization platform, seamlessly integrated into our offerings. With Tableau as part of our service portfolio, VDOIT Technologies enables you to unlock the full potential of your data, transforming it into actionable insights and driving informed decision-making.
Why Tableau is More Than Just Data Visualization
Visualize Success
Transforming raw data into actionable insights is pivotal for modern businesses. With Tableau’s intuitive visual analytics platform, you can unlock the full potential of your data.
Fully utilize the power of interactive dashboards, charts, and graphs to gain deeper understanding and make informed decisions.
Streamlined Operations
Tableau accelerates business growth by streamlining operations. From sales and marketing to finance and operations, Tableau empowers teams to analyze data efficiently, identify trends, and optimize processes. By automating reporting and data analysis, Tableau enables businesses to focus on innovation and strategic initiatives.
Data-Driven Decisions
In today’s competitive environment, data-driven decision-making is non-negotiable. Tableau equips businesses with the tools to derive actionable insights from complex data sets in real-time. By visualizing trends, patterns, and outliers, Tableau facilitates proactive decision-making, leading to enhanced efficiency and competitive advantage.
Agile Adaptation
The ability to adapt swiftly to changing market dynamics is crucial for sustained growth. Tableau’s agile analytics platform enables businesses to respond promptly to market shifts, identify emerging opportunities, and mitigate risks. With Tableau, businesses can stay ahead of the curve and drive continuous innovation.
Empowered Collaboration
Collaboration is at the heart of every successful business endeavor. Tableau fosters collaboration by providing a centralized platform for data sharing and analysis. By breaking down silos and facilitating cross-functional collaboration, Tableau accelerates innovation and drives business growth.
Our Portfolio
Data-Driven Excellence
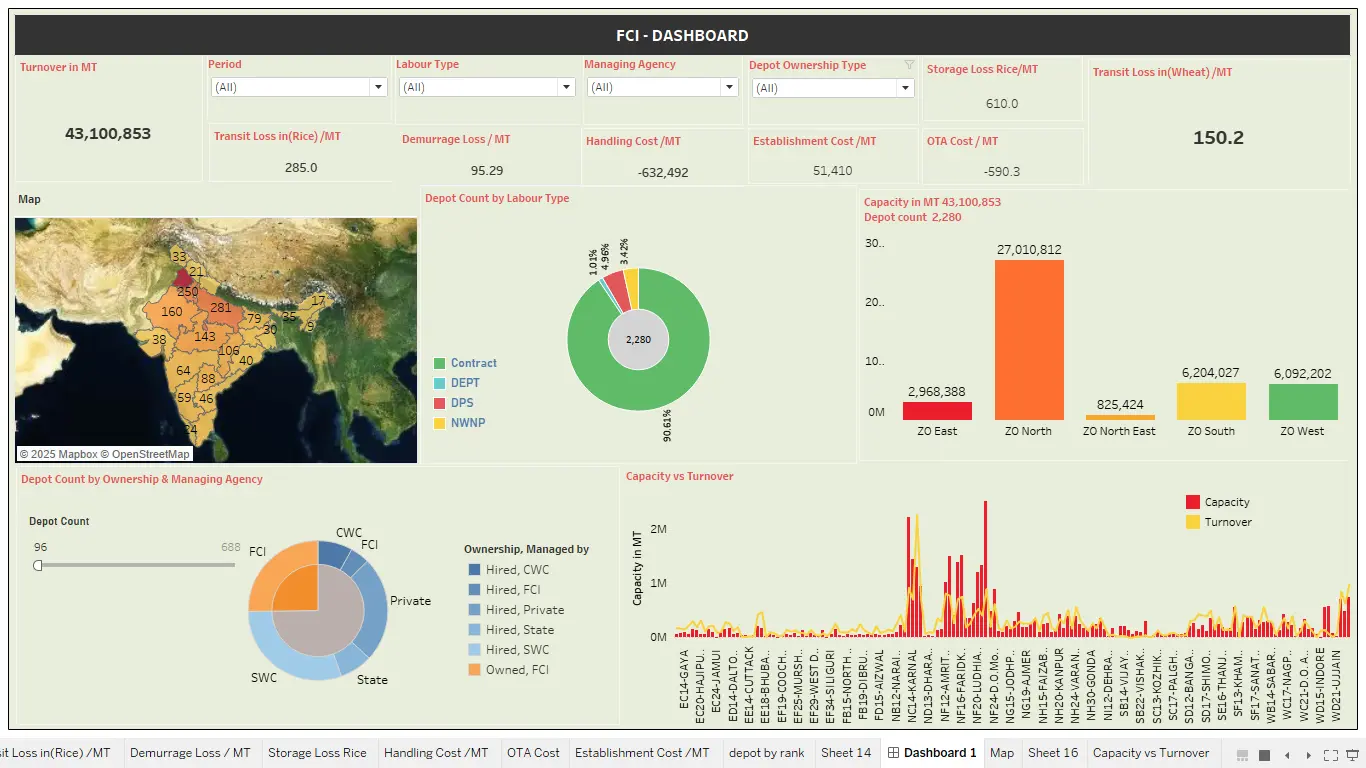
Food Corporation of India
- Capacity & Storage: Analysis by CWC, private transit, and depots.
- Procurement & Distribution: State-wise food stock movement.
- Labor & Agency Performance: Insights from Labour Department, DPS Agriculture, and other agencies.
- Depot Count & Efficiency: Tracking storage and supply chain effectiveness.
It enables data-driven decision-making to optimize food security and logistics.
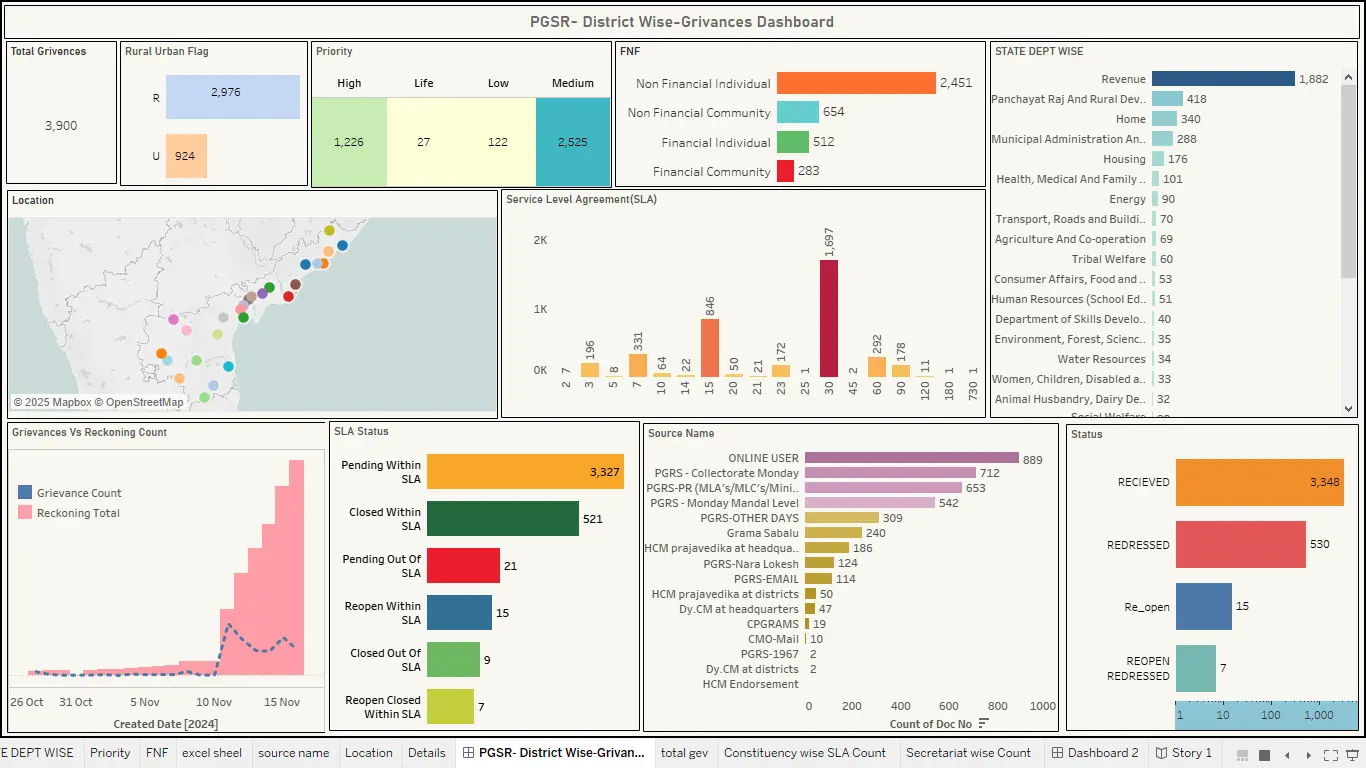
PGSR District-Wise Grievance Report
This dashboard provides a district-wise analysis of grievances, helping authorities track and resolve issues efficiently. Key insights include:
- Total Grievances (Urban & Rural)
- Priority Levels & FNP (First Notified Point)
- Source Name & Status
- Grievance vs. Reckoning Count
- SLA Compliance & Resolution Tracking
- State-wise & Department-wise Performance
It enables data-driven decision-making to enhance grievance redressal and accountability.
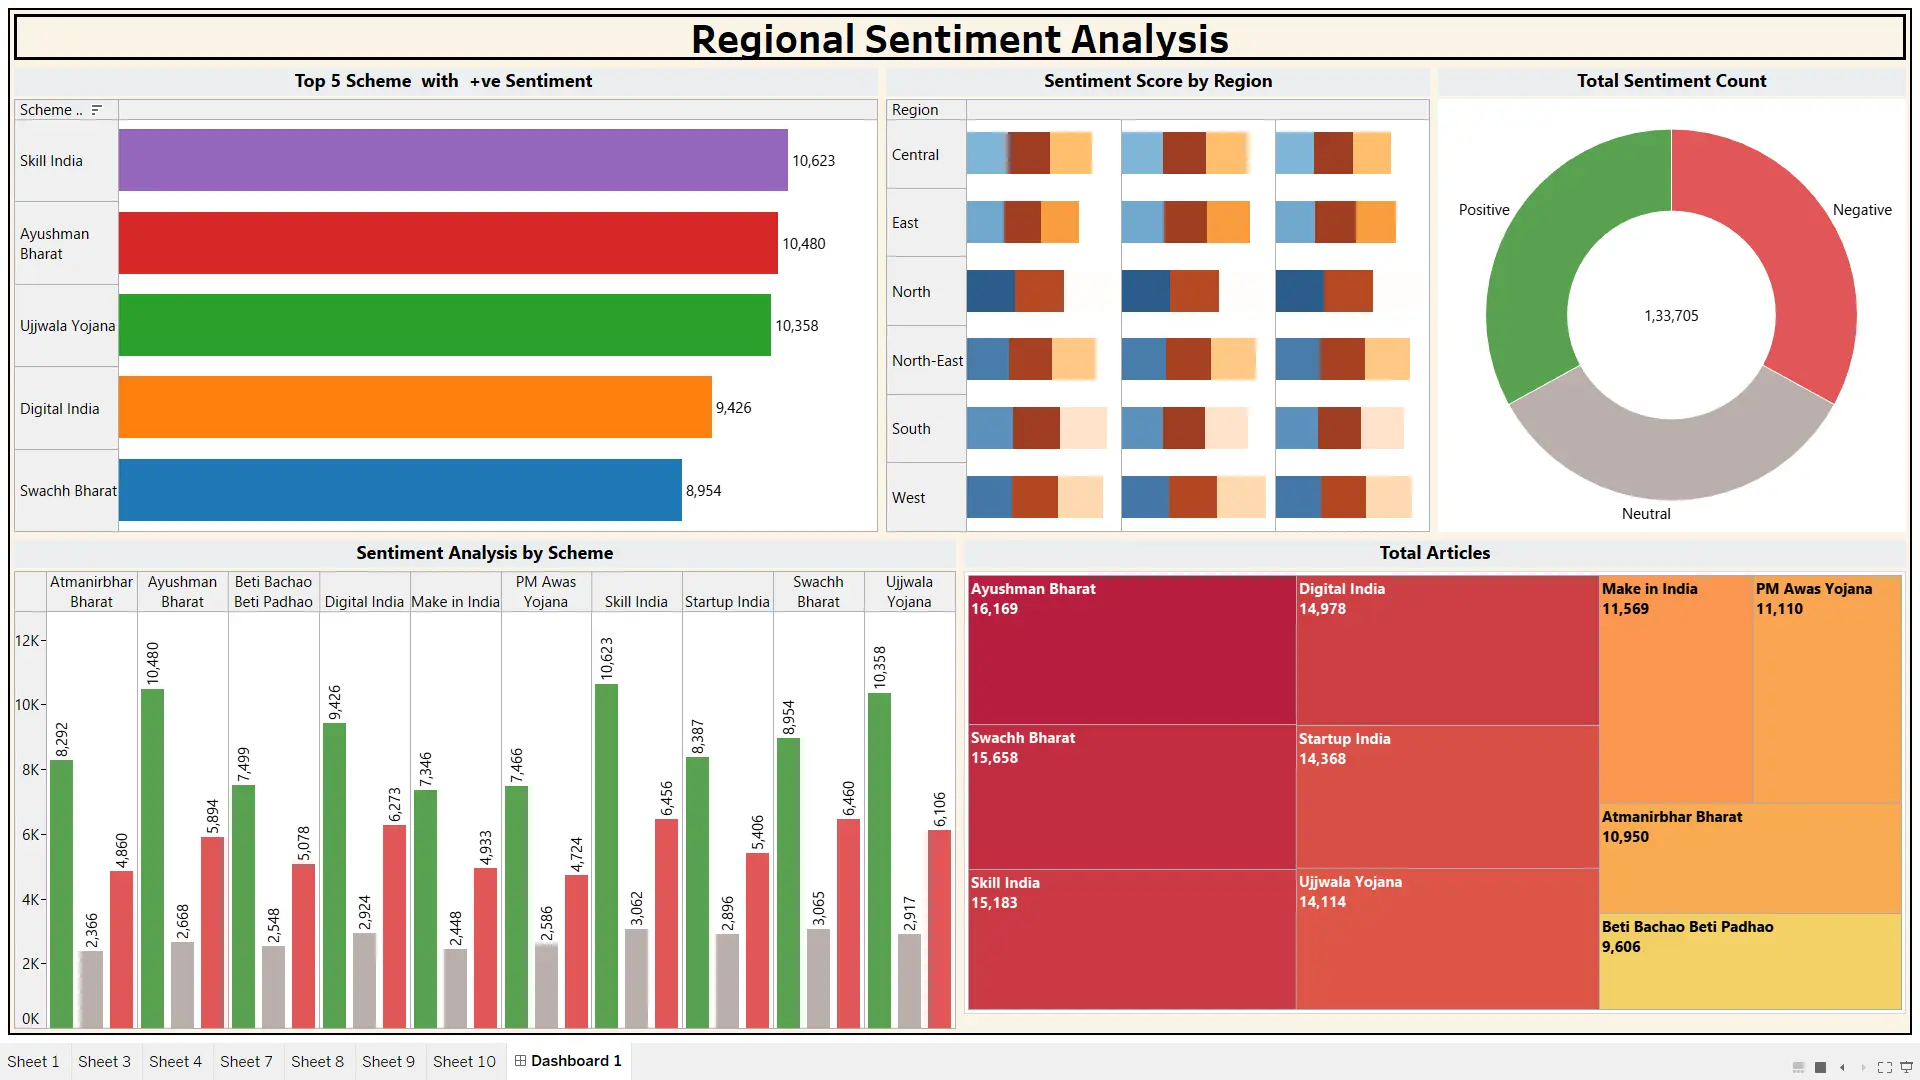
Sentiment Analysis on Government Schemes
Sentiment Breakdown: Positive, Negative, and Neutral classifications.
Total Analysis by Scheme: Overall sentiment distribution across different schemes.
Sentiment by Region: Regional variations in public sentiment.
Total Articles Analyzed: Volume of data considered for insights.
This analysis helps policymakers gauge public response and refine strategies for better outreach and impact.
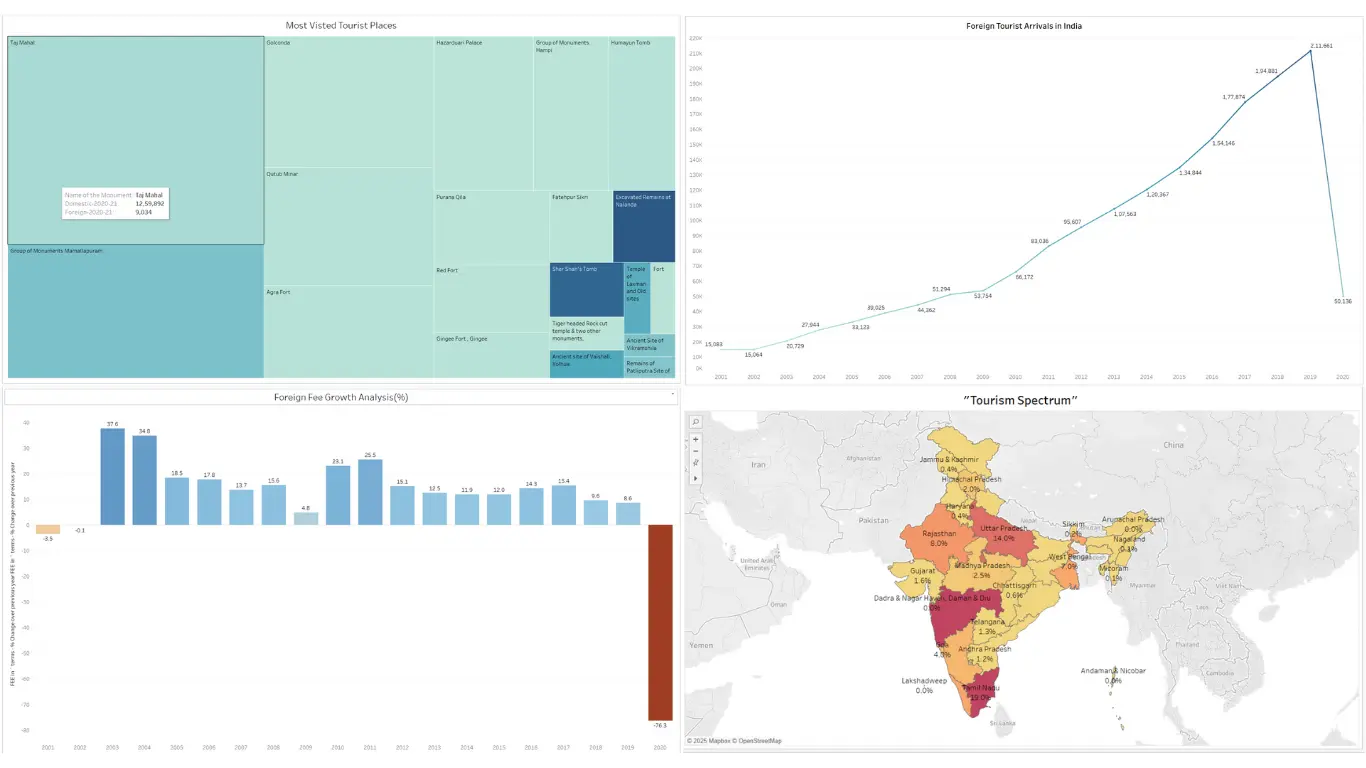
Tourism Insights in India
Most Visited Tourist Places: Top destinations attracting visitors.
Foreign Tourist Arrivals: Country-wise and seasonal trends.
Tourist Spectrum: Demographics, preferences, and travel patterns.
Foreign Fee Analysis: Revenue insights from international tourists.
It helps stakeholders optimize tourism strategies and enhance visitor experiences.
What We Provide with Our Tableau Consulting Services
Expert data visualization, analysis, and strategic insights with customized Tableau solutions to drive informed decision-making and business growth.

Reports and Dashboards
Transform your data into insights with our customized reports and interactive dashboards. We create visually compelling, easy-to-understand Tableau dashboards that enable real-time decision-making and drive business success.

Data Integration
Seamlessly integrate data from multiple sources with our Tableau consulting services. We ensure smooth data connections and accurate data blending, providing a unified view of your business for comprehensive analysis and insights.

Handle Large Data
Efficiently manage and analyze large datasets with our Tableau expertise. We optimize performance, enabling quick processing and visualization of vast amounts of data to deliver actionable insights and drive data-driven decisions.

Data Visualization
Bring your data to life with our advanced data visualization services. We create intuitive, interactive Tableau dashboards that simplify complex data, highlight key insights, and support informed decision-making for your business.

Data Maintenance
Ensure data integrity with our comprehensive maintenance services. We perform regular audits, error detection, and updates to keep your data accurate, secure, and up-to-date for reliable Tableau insights.
Analytics for Everyone
Scalability
It can help your organization expand its use of Tableau as your data needs and grow. Enjoy high reliability and smooth cross-platform compatibility for any group, big or small.
Self-Service BI
Allow users to explore, visualize, and analyze data in real-time without involving the IT department. Tableau’s drag-and-drop feature makes it easy to use, and it speeds up decision-making at the organizational level.
Intuitive Analytics
Tableau is easy to use and promises fast analytics, as captured by its beautiful interface. Make data exploration and analysis as easy as pushing a button and magnificently enjoy beautiful graphs and charts that can be manipulated directly.
Dashboard Talks
Design engaging and user-friendly dashboards that turn hard data into easy-to-understand visuals. Use strong visuals to present the data, and then discuss it. This will lead to better outcomes and health strategies.
Import Data in Minutes
Various such big sources can be obtained in Tableau within minutes. Make data integration fast and seamless. It should allow for easy analysis and visualization.
Rapid Development
Rapid development delivers the ability to speed up your BI initiatives. Tableau allows the creation and deployment of data visualizations and dashboards, which can save time for insight.
On-the-Fly Data
Import, blend, and clean data and make live connections in Tableau through its on-the-fly data options. Make prompt and informed decisions based on the functionality of real-time data embedded in the analytical visuals.
Highly Secure
It has numerous security features, such as user authentication and data encryption, to secure your data. Go to Tableau today. Guarantee adherence to the best practices used in the industry and protect your business intelligence landscape from threats.
VDOIT Capabilities in Tableau Professional Services
VDOIT offers expert Tableau services, including data visualization, integration, and maintenance, to drive data-driven insights and enhance business decision-making.
Tableau product ecosystem
Unlock the full potential of the Tableau product ecosystem with our expertise. We leverage Tableau Desktop, Server, Online, Prep, and Public to create cohesive, powerful data solutions that drive informed decisions.
Data analytics CoE (Do We Have a CoE?)
Our Data Analytics Center of Excellence (CoE) provides advanced expertise in data analytics, ensuring best practices, innovative solutions, and strategic insights to optimize your business performance.
Why Choose VDOIT for Tableau Consulting
Choose VDOIT for Tableau consulting for our expert insights, customized solutions, and seamless integration. We ensure optimized data visualization and actionable results for your business.
Customized Dashboard Development
Tableau enhances data analysis through features that allow for customized dashboard development. It creates an opportunity to explore the data interactively, reveal insights, and make decisions with the help of dynamic figures adjusted to the particular user.
End-to-End Tableau Consulting
Tableau has products like Tableau Desktop, Server, Online, Preparation, and Public. Both have features that make them ideal for data visualization and analysis. Fully integrated end-to-end Tableau consulting empowers the enhanced use of these instruments.
Tableau Performance Tuning
Tableau allows the user to connect to multiple data sources: databases(SQL, Oracle), cloud services(AWS, Google BigQuery), spreadsheets (Microsoft Excel), and web data connectors. Tableau Performance Tuning enhances these connections to improve users’ analysis.
Tableau Data Management
VDOIT can help with your Tableau needs regarding Tableau Data Management, making your data accessible to integrate and perform optimally, and provide you with the right dashboards to make the right decisions.
Tableau Go-Live Support
Let’s work together! VDOIT offer Tableau Go-Live Support, help in successful implementation, and analysis that involves getting the Tableau to run optimally. They are available for support to help make the project effective and valuable.

Comprehensive Data Insights
Utilize the power of Tableau to turn raw data into meaningful insights. With intuitive interfaces and powerful analytical capabilities, Tableau empowers you to explore, visualize, and understand data trends, promoting informed decision-making and strategic business actions.
Advanced Analytics Tools
Leverage Tableau’s advanced analytics tools for in-depth data exploration. From forecasting and clustering to sophisticated trend analysis, Tableau provides the capabilities needed to uncover hidden patterns and make accurate predictions, enhancing your ability to plan and execute effective strategies.


Seamless Data Integration
Connect effortlessly to a wide range of data sources with Tableau. Whether it’s databases, cloud services, or spreadsheets, Tableau integrates data from multiple origins, providing a unified view that enriches your analyses and supports comprehensive, data-driven insights.
Interactive Dashboards & Reports
Experience the interactivity of Tableau’s dashboards and reports. Customize, filter, and drill down into your data in real-time, making your analysis more engaging and insightful. This dynamic approach enables quicker, more informed decisions and a deeper understanding of your data.

Why Tableau?
Tableau is one of the best analytical tools for classifying raw information into appealing, dynamic, and draggable dashboards and reports. It enables real-time data analysis and works with multiple sources. It has robust features, like predictive analysis and geographic data. Tableau is easy to use and customizable.
1. Quick to Implement
3. Connect To Multiple Data Sources
2. Drive Smarter Decisions
4. Highly customizable dashboards
FREQUENTLY ASKED QUESTIONS (FAQS)
1. What is Tableau?
Tableau is a powerful data visualization and business intelligence tool that helps users analyze, visualize, and share data insights. It allows for the creation of interactive and shareable dashboards, facilitating data-driven decision-making.
2. What are the key features of Tableau?
Tableau offers features like data blending, real-time analytics, robust data visualization, interactive dashboards, and support for multiple data sources. It also provides easy integration with various databases and cloud services, making data analysis more efficient and accessible.
3. How does Tableau improve data analysis?
Tableau improves data analysis by enabling users to quickly visualize complex datasets through intuitive drag-and-drop interfaces. Its interactive dashboards allow users to explore data in depth, uncover trends, and gain actionable insights without needing advanced technical skills.
4. What are the different products offered by Tableau?
Tableau offers several products, including Tableau Desktop (for individual use), Tableau Server (for enterprise-wide analytics), Tableau Online (a hosted version of Tableau Server), Tableau Prep (for data preparation), and Tableau Public (a free version for sharing public data).
5. What types of data sources can Tableau connect to?
Tableau can connect to a wide variety of data sources, including spreadsheets (Excel), databases (SQL Server, Oracle), cloud services (AWS, Google BigQuery), and web data connectors. This flexibility allows users to integrate and analyze data from multiple sources seamlessly.
6. How VDOIT Can Help Serve on Your Tableau Projects?
VDOIT can assist with your Tableau projects by providing expert consulting, data integration, dashboard development, and training services. With a team of certified Tableau professionals, VDOIT ensures effective data visualization and analytics solutions tailored to your business needs, driving better decision-making and insights.
Let’s Work Together
We look forward to start a success journey with you. Please do write to us how can we help you.
